
Welcome to the publications page. As an author for Medium, I work explicitly with medium claimed and autonomously possessed distributions to deliver content for their perusers week by week. My writing pivots around the subjects of Python Programming, Data Science, Web Design, and Android. This includes tutorials, DIY projects, programming from scratch, and building apps as well. Currently, I have written 51 articles and published them in 6 different publications which are as shown below:
Towards Data Science - A Medium publication sharing concepts, ideas, and codes.
Analytics Vidhya - Analytics Vidhya is a community of Analytics and Data Science professionals.
Kt.Academy - Blog with mission to simplify Kotlin learning.
The Startup - Medium's largest active publication, followed by +738K people.
UX Planet - UX Planet is a one-stop resource for everything related to user experience.
Level Up Coding - Coding tutorials and news. The developer homepage gitconnected.com
I share my contemplations on Computer Science and Programming on my Medium and its publications and conveying the erudition for both technical and non-technical readers.
Publication Statistics
51
Articles
789,883
Views
341,545
Reads
1,047
Followers
Online Publications
HTML Forms vs Bootstrap Forms
Published on December 29, 2020 - 4 min read - In Dev Genius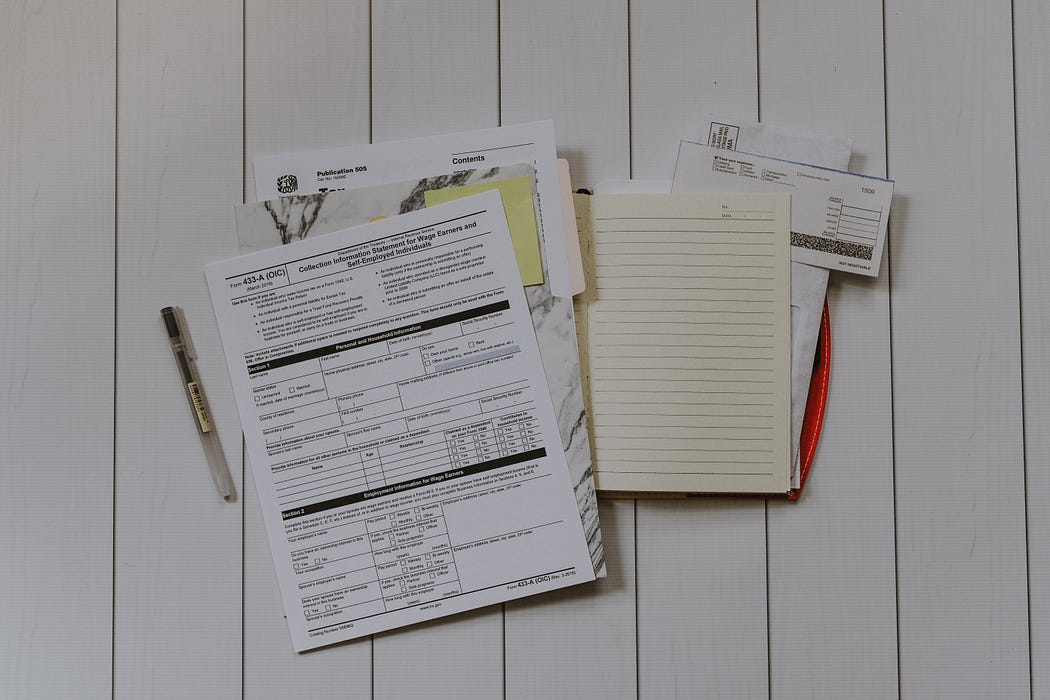
Description
In this short tutorial, let us understand the prominence of using Bootstrap Forms over HTML forms. An HTML form aka a webform is used to collect data from the users. There are many ways that users can fill web forms such as text fields, radio buttons, drop-downs, and checkboxes. In this short tutorial, we will learn to implement a simple HTML and Bootstrap forms and see the difference between them. Primarily, you will understand the idea of responsiveness and its importance in this short tutorial.
Read More
The two Google Search Python Libraries you should never miss!
Published on December 21, 2020 - 5 min read - In Analytics Vidhya
Description
In this article, let us discover the usage of the two most used Google Search Python libraries. This morning while I was looking for search-related Python API, I saw these two amazing Google Search Libraries written in Python. So I thought of bringing them to light and share them with you guys. So that next time when you are in need, these libraries will be at your fingertips.
Read More
Presenting Python code using RISE
Published on December 11, 2020
Click to expand/collapse
In this article, you will use RISE as a Python jupyter notebook extension for turning it into a live presentation.
Scenario
Your boss/professor tells you to find the largest number in a Python list and present the result in front of the whole employees/classmates. Now there are some rules that you need to follow to impress your boss/professor. They should be able to see both the documentation and code in this presentation. You should execute the code too. You may use any presentation tool of your choice. Now, how would you be able to present your code and ace it at the same time?
Read More
How to handle JSON in Python?
Published on December 7, 2020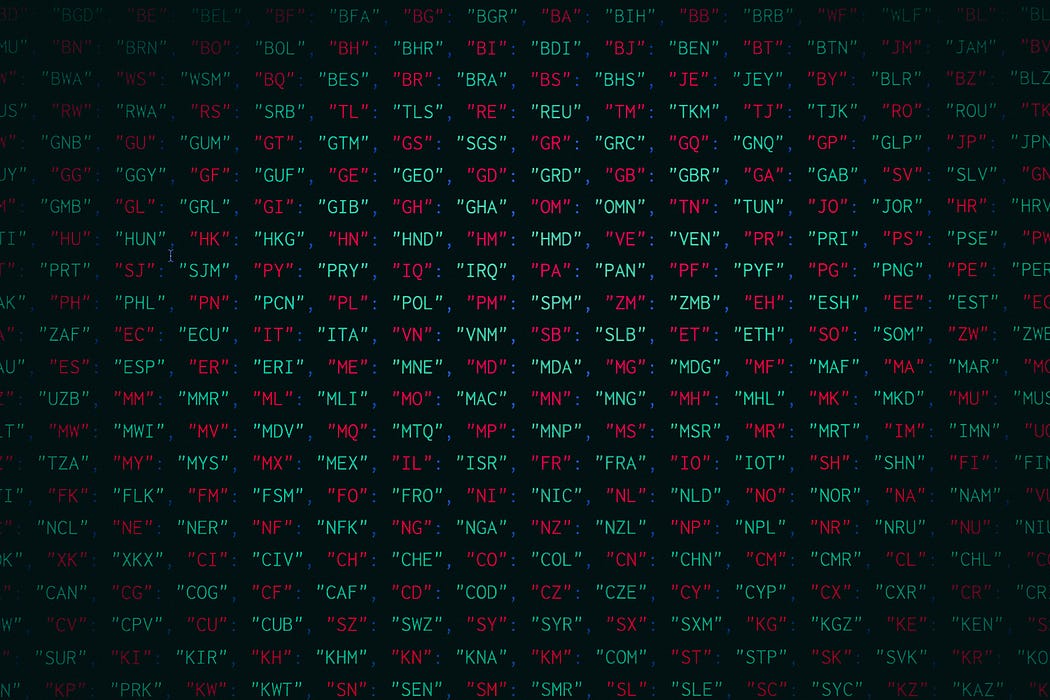
Click to expand/collapse
In this article, we will learn and understand how to parse, read, and write JSON in Python. We will see different conversions of JSON into different Python objects along with a bonus
Definition
JSON is the abbreviation for JavaScript Object Notation: one of the easiest data formats for humans being like you and me to read and write. JSON is often declared as a text format that is completely language independent. It is based on a subset of the JavaScript Programming Language Standard ECMA-262 3rd Edition — December 1999.
Read More
Using the Pandas DataFrame in Day-To-Day Life
Published on September 11, 2020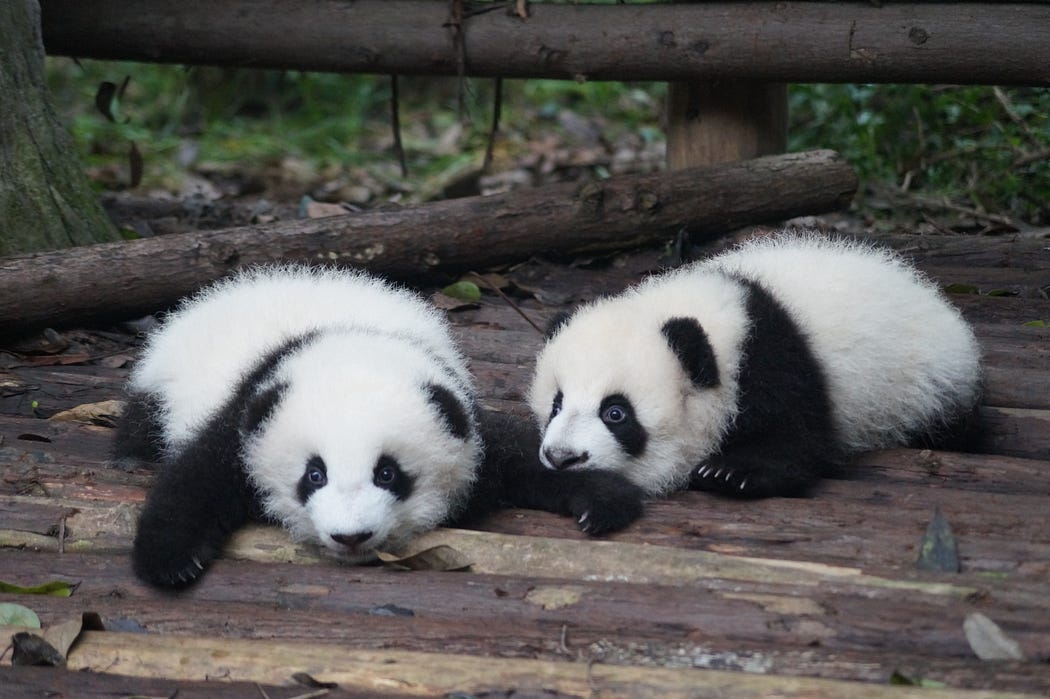
Click to expand/collapse
In this article, you will know how to use Pandas DataFrame in everyday life.
Before getting started let us do a quick revision, Pandas is a python library that gives elite, and simple to-utilize information structure for data analysis tools for python programming language. Show below is the article which will help you gain your understanding level in the Pandas library. Don’t forget to have a look at it. In fact, this is the official docs. It is worth reading it.
Read More
Global, Local and Nonlocal variables in Python
Published on August 29, 2020
Click to expand/collapse
In this tutorial, let us learn the usage of Global, Local and Nonlocal variables in Python.
First of all, I’m not the one on that image above. I’m just a benevolent writer who is here to talk about one of the most confusing concepts in Python programming “Global, Local and Nonlocal variables”. I know after reading the title you will be like “Why should I even worry about this”. Well, the answer is sometimes not knowing these teeny tiny itsy bitsy would cost you a lot. So without further ado, let’s get started.
Read More
Rendering Images inside a Pandas DataFrame
Published on July 6, 2020
Click to expand/collapse
Ever thought about rendering images inside a dataframe? I’m glad you did!
I can see the question mark (?) on most of your faces. Because even I had one before discovering that we can also render images inside a dataframe. And believe me, it’s simple and easy, all you need to know is to create a dataframe and I’ll pick you up from there.
Read More
Reading An Image In Python (Without Using Special Libraries)
Published on June 18, 2020
Click to expand/collapse
Just say goodbye to OpenCV, Matplotlib, PIL except for Numpy!
Well, the above picture is splendid, isn’t it?. It’s a masterpiece to me. Nonetheless, have you ever thought or asked yourself this one million dollar question:
What is an image made up of?
Now, before reading this entire tutorial, I want you guys to answer this question in the comment section, in that way you can give some work to your brain. Anyway, for those of you never answered the question or didn’t know the answer, by reading this article you can finally answer the question with no hesitation. Enough of this hype, let’s get started!.
Read More
Mastering the Bar Plot in Python
Published on June 11, 2020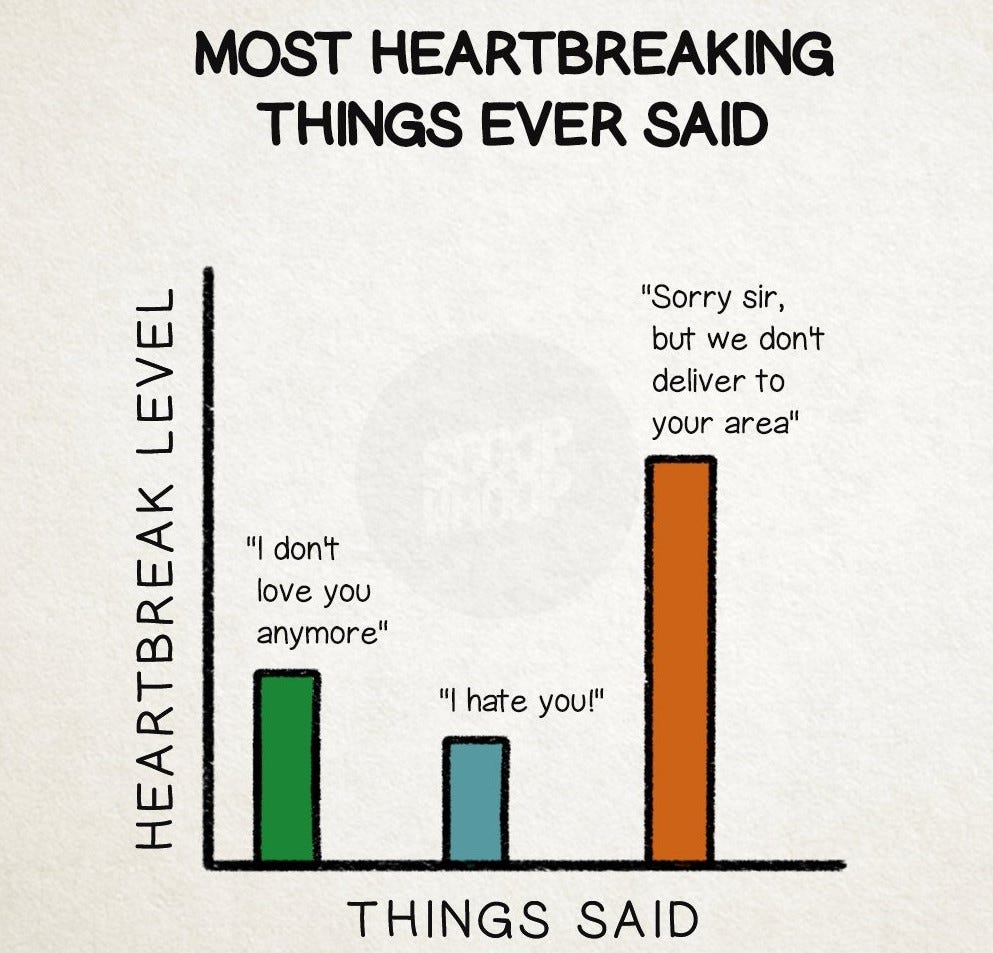
Click to expand/collapse
In this tutorial, let us learn the “Bar Plot” visualization in-depth with the help of examples.
Introduction
The data visualization is one of the most important fundamental toolkits of a data scientist. A good visualization is very hard to produce. Often during a presentation, people don’t understand well enough the data, or the statistics involved but showing them a good visualization will help them understand the story we are trying to convey them. Therefore, they say a picture is worth a thousand words.
Read More